At some point, all of us write some code that breaks or doesn’t work. When you run into an error, you may feel that you don’t know what to do. Don’t worry, this post will help improve your debugging skills.
Debugging is the process of identifying and removing errors in order to make your code run as expected. It is a challenging but fun task that encourages problem-solving, attention to detail, and working in a sequence. It requires practice. Let’s take a look at the debugging tools you can use to fix code errors.
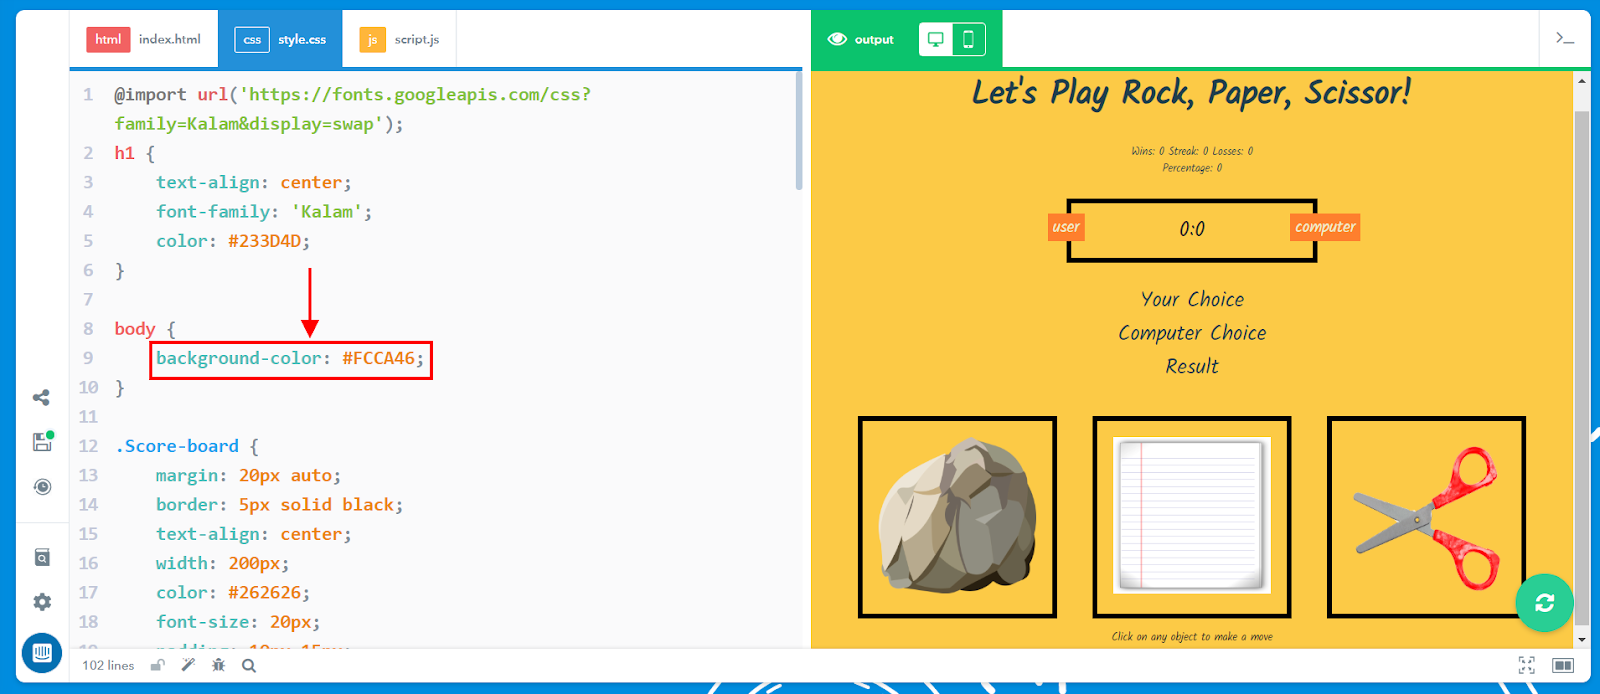
1. Color coding - On BSD online, every code is color-coded. These colors can help you spot errors easily. Take a look at the examples below:
Missing Quotation marks after the word name. This causes the rest of the code to have the wrong colors.
The color theme in Default mode:

It should be like this:

2. The use of the tidy code button - this is located at the bottom left corner of your screen beside the bug button. Tidy code helps you to organize your code. But in order for you to use it, the code must be unlocked.

Here is a gif to guide you

3. Pairing tag - Most HTML tags require a pair: an opening and a closing tag. Remember that the closing tag has a forward slash (/) which indicates the closing tag. (Note: <img> tag is an example of an exception - it does not require a closing as it is a self-closing tag). Click on the opening or closing tag to see a highlight on its respective pair:

4. JavaScript error message over the run code.
When JavaScript code is incorrect, you will not see the intended output.
Note: You may not also see the intended output when something is missing in your HTML or CSS tags. Look at the image below:
(HTML: <div> closing tag is missing) Broken output

Intended output:

(CSS: Incorrect spelling) Broken output

Intended output:
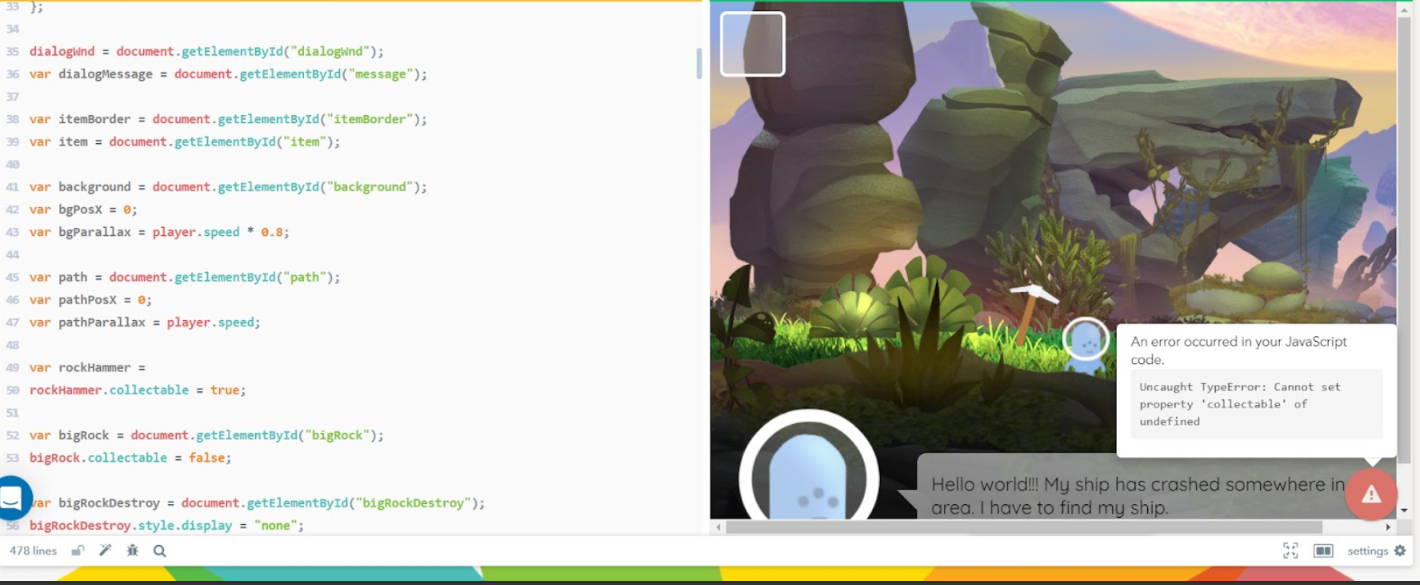
5. Using the debug button
Step 1: Identify the error.
As you click on the bug icon on the bottom left of your screen, which is known as the “Display Code Errors”, it will display errors in your code.

Step 2: Find the error
Check if there are any errors in HTML, CSS, and JS. In your script, having a red “X” sign (red circle) beside the line number means there is something wrong with your code that needs debugging. The image below shows an example of the errors displayed.

Step 3: Analyze the error
Hover over these signs to identify the error/s. Read the error message to understand which part of the code needs to be fixed.

Step 4: Try fixing the error
Step 5: Lastly, after debugging, run your code and see if you get the correct output that you want.
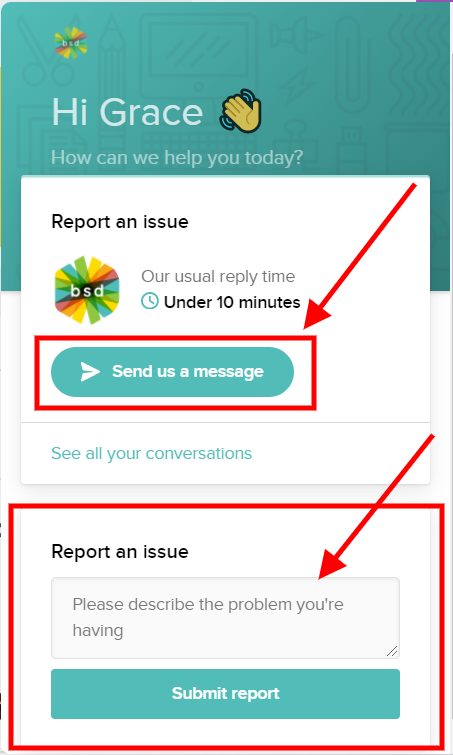
Step 6: For teachers:
If you are not able to resolve errors that you may encounter, you may reach out to our Support Specialists through chat support.
Want to learn more about common coding errors and how to recognize them? See this document: Recognizing Common errors